Climate change and energy
Test your memory
This game will allow you to work on your memory but also to learn on the carbon footprint of products/individuals across the world. The carbon footprint is defined as the total amount of greenhouse gases associated with a product or a person (through his consumption patterns), usually expressed in carbon dioxide equivalent (CO2e).
The tool thus focuses on the carbon footprint of 12 common consumption products and those of an average citizen in 12 different countries. It works like a classic Match Pairs Mind Game , the difference being that the two cards you need to match are not fully identical.
When the game begins, only the back of the cards appear (the same for every card). Click on one card then another, if they match they will stay face up. If not they will be turned back.
The level is completed only when you find all the pairs and the cards are all face up.
All the pairs are presented in the table below, as well as some explanations of the carbon footprint associated (carbon footprint expressed in grams or kg of CO2e). Have a careful look at this before you start playing.
Pairs Table
Strawberries


This data corresponds to the production of 250g of Strawberries, conserved at ambient temperatures, off season, imported from Europe and Mediterranean countries, for a consumer based in France.
Potatoes
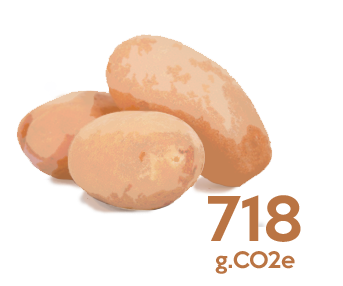
This data is for 250g of Potatoes, conserved at ambient temperatures, outside the seasons, imported from Europe and Mediterranean countries, for a consumer based in France.
Salad

This data is for 250g of Salad, conserved at ambient temperatures, outside the seasons, imported from Europe and Mediterranean countries, for a consumer based in France.
Banana


This data is for 250g of Bananas, conserved at ambient temperatures, outside the seasons, imported from Europe and Mediterranean countries, for a consumer based in France.
Apple
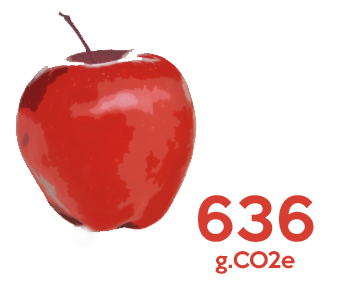
This data is for 250g of Apples, conserved at ambient temperatures, outside the seasons, imported from Europe and Mediterranean countries, for a consumer based in France.
Beef

This data is for 250g of Beef, conserved at ambient temperatures, imported from Europe and Mediterranean countries, for a consumer based in France.
Chicken

This data is for 250g of Chicken, conserved at ambient temperatures, imported from Europe and Mediterranean countries, for a consumer based in France.
Egg
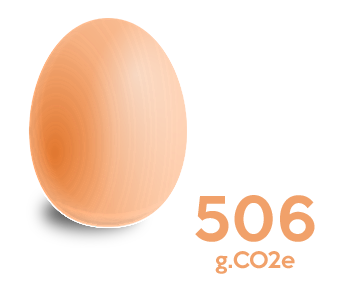
This data is for 250g of Eggs, conserved at ambient temperatures, imported from Europe and Mediterranean countries, for a consumer based in France.
Milk

This data is for 250g of Milk, conserved at ambient temperatures, imported from Europe and Mediterranean countries, for a consumer based in France.
Coffee
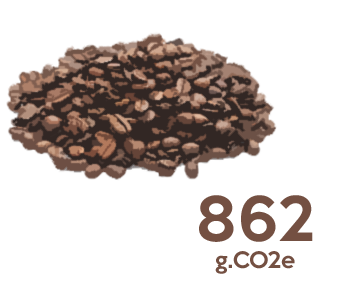
This data is for 250g of Coffee, conserved at ambient temperatures, imported from Europe and Mediterranean countries, for a consumer based in France.
Sugar
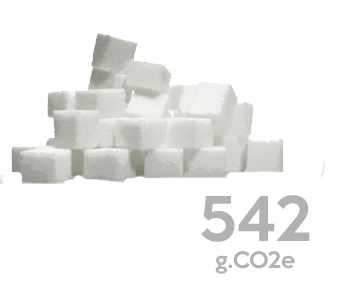
This data is for 250g of Sugar, conserved at ambient temperatures, imported from Europe and Mediterranean countries, for a consumer based in France.
Mobile phone (smartphone)


The carbon footprint related to the fabrication of a mobile phone was estimated around 16 kg of CO2 on average.
France
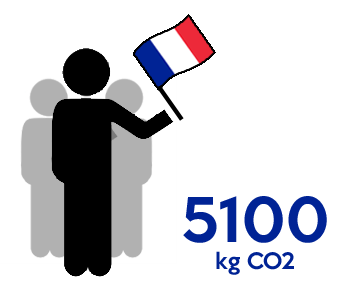
This data is for CO2 emissions (in tons of CO2e) per capita in 2013 for France
Belgium
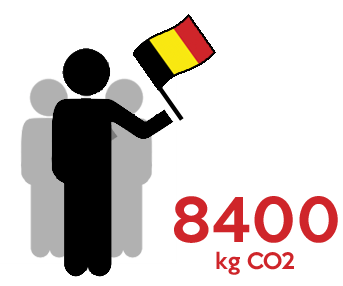
This data is for CO2 emissions (in tons of CO2e) per capita in 2013 for Belgium
Italy
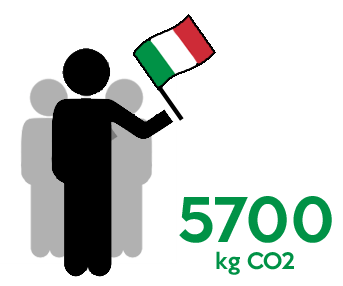
This data is for CO2 emissions (in tons of CO2e) per capita in 2013 for Italy
Hungary
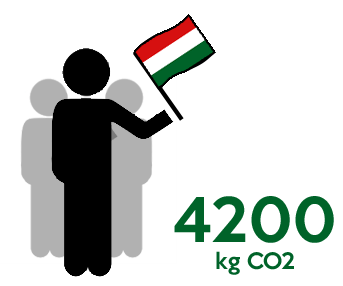
This data is for CO2 emissions (in tons of CO2e) per capita in 2013 for Hungary
Croatia
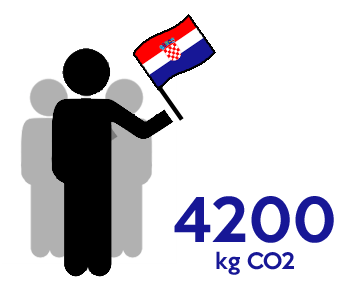
This data is for CO2 emissions (in tons of CO2e) per capita in 2013 for Croatia
Germany
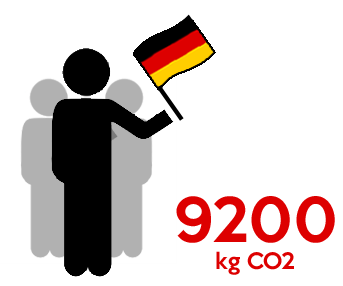

This data is for CO2 emissions (in tons of CO2e) per capita in 2013 for Germany
Spain
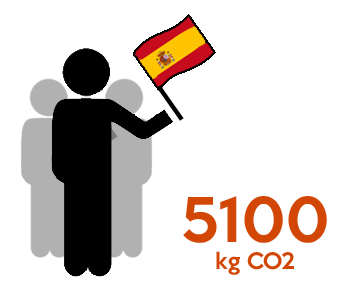
This data is for CO2 emissions (in tons of CO2e) per capita in 2013 for Spain
United Kingdom
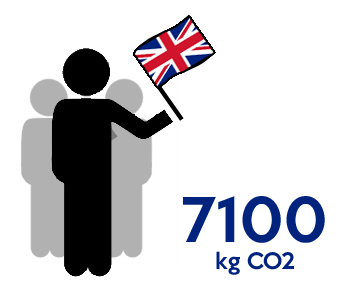
This data is for CO2 emissions (in tons of CO2e) per capita in 2013 for United Kingdom
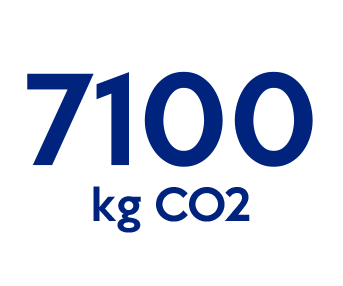
USA
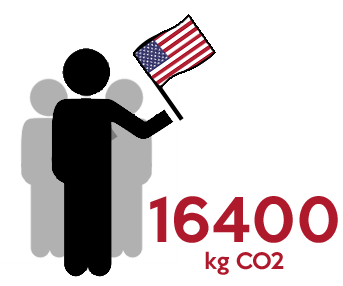
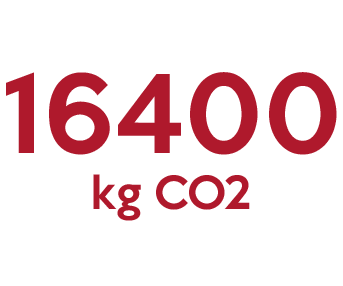
This data is for CO2 emissions (in tons of CO2e) per capita in 2013 for United States
China
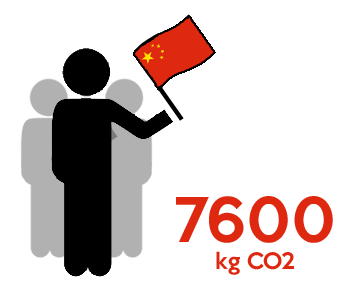
This data is for CO2 emissions (in tons of CO2e) per capita in 2013 for China
Senegal
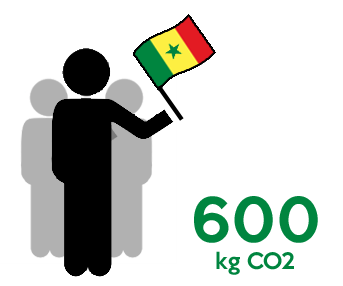

This data is for CO2 emissions (in tons of CO2e) per capita in 2013 for Senegal
New Zealand
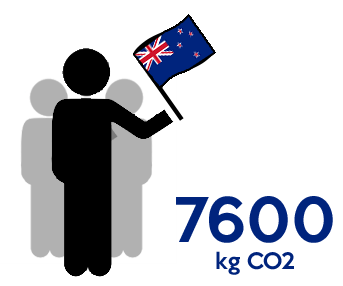
This data is for CO2 emissions (in tons of CO2e) per capita in 2013 for New Zealand
The references used for these tools are the following:
- Food products (Source ADEME) : http://www.bonpourleclimat.org/calcul-empreinte-carbone/
- Carbon footprint of individuals: http://data.worldbank.org/indicator/EN.ATM.CO2E.PC
- Carbon footprint of a mobile phone (average data, from the French operator orange): https://dreamcafe.orange.fr/a-grignoter/102/quelle-est-l-empreinte-carbone-de-l-usage-du-telephone-portable